Once an email job has been sent and enough time has gone by to assume that most recipients have received the message and have opened it, data from selected open-up and click-through events can be gathered. This data can be used to generate reports in two ways. The first way is by clicking on the Delivered Jobs icon (covered in Section 9.3 Delivered Job Reports). The second way is by clicking the Tracking Reports icon. Both of these methods are available from the home page or on the left side of most screens.
· Delivered Jobs – Lists all of the email jobs that have been delivered in a tabbed table format. The first tab contains a summary table listing details about each job. The second tab contains access to predefined reports (“quick reports”) for that job, available only if tracking is switched on for the job. Click on the type of report desired and a temporary report is automatically generated based on the selected settings. This temporary report is not automatically saved. To save the quick report, click on the Create Report icon at the bottom of the report. This opens the Define Report screen. Click [OK] to save the report and return to the reports list. Click [Save & Execute] to execute the report again (display it) and save the quick report as a regular report.
· Tracking Reports – Opens the list of current reports, if any. Clicking the [New Report] button opens a series of screens that guides the user through the process of building a new customized report by defining data to collect and how to view or download that data. Clicking on the Edit link of an existing report opens a series of screens that guides the user through the process of editing the report. The Tracking Reports interface is the only way to create reports based on data from multiple jobs.
LISTSERV Maestro can generate several different types of reports with these methods, or data can be downloaded for use in other statistical analysis programs. For quick reports on delivery tests, click on the Test Reports tab on the Delivered Job Details screen. For more information on test reports, see Section 7.3 Running Test Reports.
Tip: In many cases, it is easier to start from one of the quick reports available from the Delivered Jobs list, save it, and then make changes using the edit reports pages, rather than starting from scratch.
Editing tracking reports is a more detailed way to generate custom reports. Unlike the quick reports available from Delivered Jobs (or Test Reports for delivery test data), it is possible to combine data from multiple jobs as well as select the color of each data source.
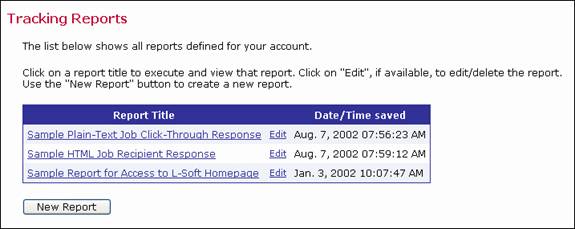
To create a new report or edit an existing report, click on the Tracking Reports icon. A listing of previously created reports appears, unless no reports have been generated.
To view a specific report, click on that report’s title.
Figure 81 Tracking Reports
To edit an existing report, click the Edit link that corresponds with that report. The Define Report screen opens.
To create a new report, click the [New Report] button. The Define Report screen opens.
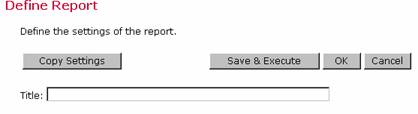
At the top of the Define Report screen, there are four buttons and a text box to enter the report’s title:
· [Copy Settings] – Copies settings from a previously generated report to the new report.
· [Save & Execute] – Saves the report and executes the collection of the selected data. A graph or table is produced based on the settings.
· [OK] – Saves any selections or entered information such as a title.
· [Cancel] – Cancels any settings or entered information.
Figure 82 The Top Part of the Define Report Screen
Below the buttons is a tabbed table. Click on the tabs to toggle between the sections.
· General Settings – Defines the time period of the report, including time zone, and team collaboration settings.
· Data Sources – Opens the Data Source wizard, a series of screens that leads the user through the process of creating new data sources. Each data source represents a single variable in the report (a line or bar). For more information, see Section 10.1.2 Adding a Data Source.
· Result Settings – Defines the type of report and how the data from the job is displayed.
The General Settings tab lets you define report period and edit the team collaboration settings.
Figure 83 Define Report Screen – General Settings Tab
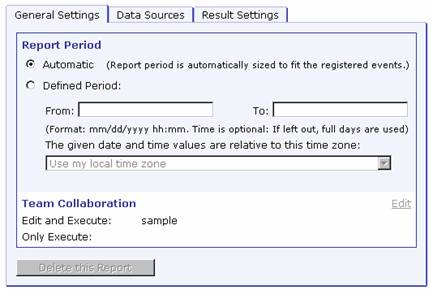
The Report Period section is used to determine the earliest and the latest points in time that are considered when the events are retrieved from Maestro Tracker.
· Automatic – LISTSERV Maestro will determine the time period to fit the registered events. From all the events of all of the jobs and/or URLs that are part of the report, LISTSERV Maestro will set the time of the earliest event as the “From” and the time of the latest event as the “To” values of the time period. If two jobs are selected for tracking, LISTSERV Maestro will select the delivery time of the first received event (open-up or click-through) from either job as the start time, and the time of the last received event from either job as the end time.
· Defined Period – User can determine the time period for the report, and make this relative to any time zone.
The Team Collaboration section contains an Edit link that is used to change the existing team collaboration settings for the report. If this link is not active, then you do not have permission to use this feature.
If you have permission to delete reports, then the [Delete this Report] button is active.
Adding a data source is a multi-step process that has to be repeated for each separate variable in the report. In Figure 84, seven different variables will be plotted on the report, so the Data Source wizard was engaged seven times to record each one. To begin defining a data source, click on the Data Sources tab.
Figure 84 Define Report Screen – Data Sources Tab
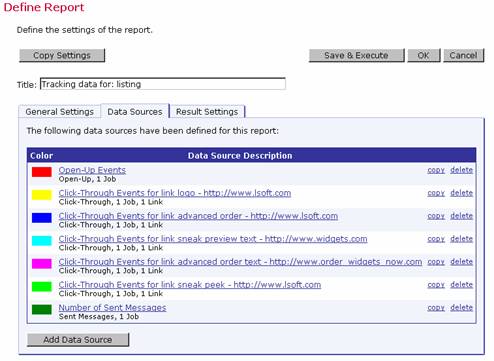
· The Data Source Description section lists the defined data sources available for use in a report. Click on the title of the data source to open the Data Source wizard and edit the selections. Click on the copy link to make a copy of the data source. Click on the delete link to delete the data source.
· The [Add Data Source] button opens the Data Source wizard, guiding you through the process of creating a new data source.
There are five screens that comprise the Data Source wizard:
· Data Source Type – Select the type of event to report on.
· Data Source Job Selection – Select which job(s) to generate reporting data with.
· Data Source Link Selection – Select which URLs to include in the report data.
· Data Source General Properties – Select the color for the data source.
· Data Source Summary – Displays a summary of the selections for the newly defined data source.
The first screen, Data Source Type defines the type of event to report on. You can select the type of tracking event – Open-Up or Click-Through; or, you can select one of the three options in the Sent Messages and Bounce Count Statistics sections to be the data source type.
Figure 85 Data Source Type Screen
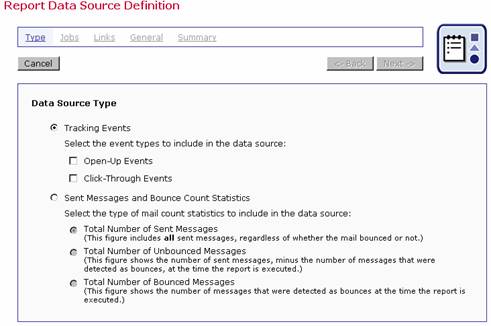
Once you are finished making your selection, click [Next ->] to continue.
On the Data Source Job Selection screen select the email job or jobs to report on. Only jobs for which the chosen event type is possible will be listed. For example, if the Open-Up Events option was selected on the previous screen, then only jobs with open-up tracking enabled will be displayed. Check the boxes next to the job or jobs to include in the data source.
Figure 86 Data Source Job Selection Screen
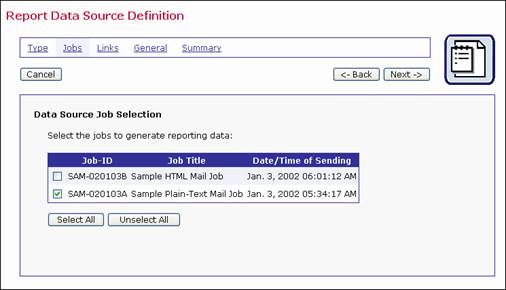
Click on the [Select All] or [Unselect All] buttons to quickly select or unselect all jobs.
Once you are finished making your selection, click [Next ->] to continue.
The Data Source Link Selection screen is only available if the Click-Through Events option was selected on the Type screen. This screen defines the URLs to report on. To select a URL to generate report data on, click on the link in the Available section to highlight it. Next, click the [Select] button to place the highlighted link in the Selected section.
Use the [All with same Alias] button to select a group of links that share the same alias (defined during the Tracking Definition phase of defining a job). See Section 6.3.1 Defining Tracking URLs for more information. Use the [All with same URL] button to select a group of links that have the same URL.
To unselect a link, click on it in the Selected section to highlight it. Next, click the [Unselect] button to replace it in the Available section. To highlight several links at once, hold down the SHIFT or CTRL key while clicking.
Figure 87 Data Source Link Selection Screen
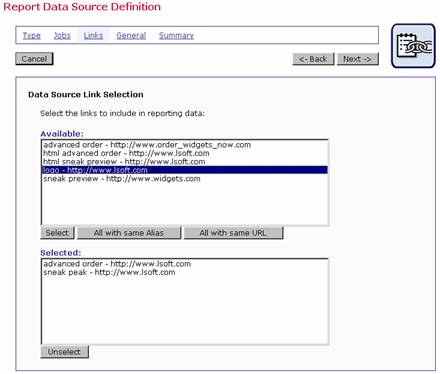
Once you are finished, click [Next ->] to continue.
The Data Source General Properties screen defines the name of the data source and the color it will appear as in the graph or data table (as in the case of Recipients Details and Event Details reports). Enter a name for the data source in the text box. Pick a name that will be descriptive of the data source when it is viewed in the report. The name of the data source will be the only way beside color to identify what the source is in the report. Select the color of the line, bar, or table for the item that is tracked. For most reports, it is usually best to select a different color for every different data source for the report, but it is not necessary.
Figure 88 Data Source General Properties Screen
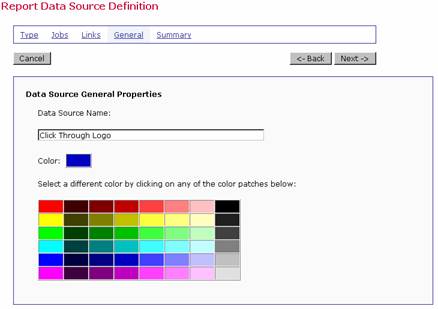
Once you are finished, click [Next ->] to continue.
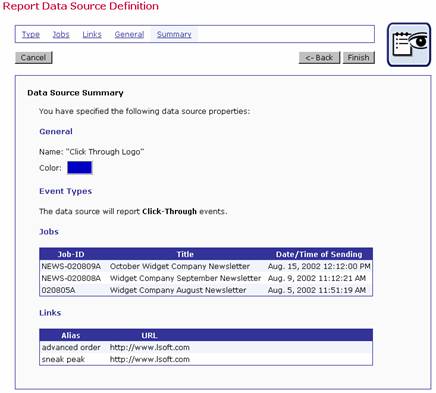
The last screen is a summary of the selections made on the previous screens. Changes can be made to the data source definition by clicking the [<- Back] button. Click [Finish] to save the Data Source Definition and return to the Define Report screen.
Figure 89 Data Source Summary Screen
Tip: It is possible to combine
data from different jobs into one report from this screen. Different jobs
can be combined into one data source or they can each have their own data
sources, depending on what the report is set up to compare.
To combine data sources from different jobs, check the boxes for the desired
jobs listed under the Job-ID column. The data from each selected job is
aggregated, and produces one line or bar on the graph. For example, to
produce a report that shows the total number of click-through events for
three jobs, first select click-through events on the Data Source Type
screen. Next, select each of the three jobs from the Data Source Job Selection
screen. From the Data Source Link Selection screen, select all the click-through
links contained in the job, and on the Data Source General Properties
screen type in a name for the data source and a color for the line or
bar. All of the click-through events from the three jobs would be added
together and produce one line or bar on the graph.
To combine data from more than one job into a report where each job is
represented by a separate line or bar, a different data source for each
job must be created. To do this, using the example above, first select
the type of data to include in the data source from the Data Source Type
screen. Next, select one job from the Data Source Job Selection screen.
Continue through the Data Source Link Selection and Data Source General
Properties screens making the desired selections. Engage the Data Source
wizard again for the second job in the report. Engage the Data Source
wizard for a third time to create the third data source in the report.
The resulting graph would have three separate lines or bars, each representing
a different job.
The third tab of the Define Reports screen is Result Settings. Select the type of report to generate as well as how the report data will be displayed. There are four basic types of report listed under the Result Type section. The type of report selected will determine the other options that appear in the lower half of the screen. Some report types will have many other options to choose, and other report types will have no additional options to select.
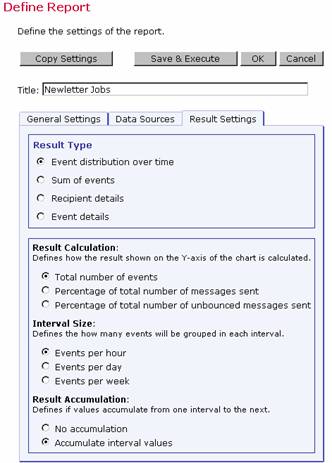
The Event distribution over time option produces a simple line graph showing the number of responses over time. Time is plotted on the x-axis of the chart and event statistics are charted on the y-axis. Options available for this report type include:
· Result Calculation – Defines how the number of events is calculated. There are three choices:
° Total number of events – The y-value of the graph will display the total number of events. For example, if 123 events have been counted for an interval, the resulting line height for that interval on the y-value will be 123.
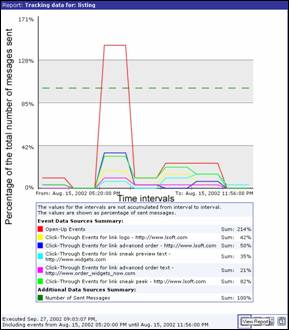
° Percentage of the total number of messages sent – The y-value shows percentages in relation to the total number of messages sent. For example, if 300 messages were sent, and if, in an interval, 150 events have been counted, then the line height for that interval on the y-value will be 50% (because 150 is 50% of 300).
Note: The percentage could be more than 100% if multiple event types are being represented by a given data source, or if single recipients produce multiple events.
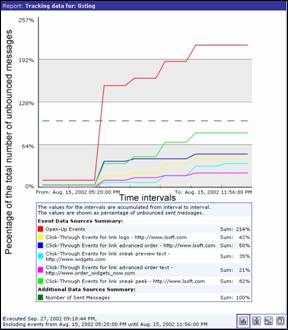
° Percentage of the total number of unbounced messages sent – The y-value shows percentages in relation to the total number of messages sent that have not been bounced. For example, if 300 messages were sent, and 50 bounced, there would be 250 unbounced messages. And if, in an interval, 150 events have been counted, then the line height for that interval on the y-value will be 60% (because 150 is 60% of 250).
· Interval Size – Defines the size (time period) for each interval on the chart. The number of events that occur within the interval will be plotted on the chart. Events can be grouped hourly, daily, or weekly.
· Result Accumulation – Defines whether values plotted on the chart will display cumulatively from one interval to the next (creating an ever increasing line) or whether they will display as non-cumulative intervals (creating a series of peaks and valleys).
Figure 90 Result Settings Tab for the Event Distribution over Time Option
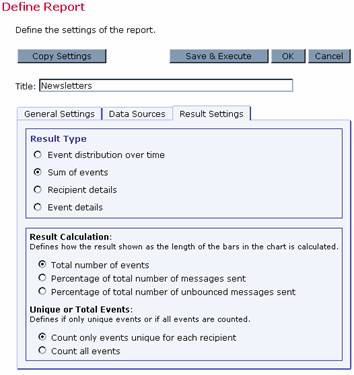
The Sum of events option produces a bar graph that shows the number of recipients who clicked on each URL and/or opened up the email message. For each data source, all events of the selected type (open-up and/or click-through), and the selected links (in the case of click-though), are summed up and displayed in the form of a colored bar.
Options available for this report type include:
· Result Calculation – Defines how the number of events is calculated. There are three choices:
° Total number of events – Displays the total number of events. For example, if 123 events have been counted, the resulting bar length will be 123.
° Percentage of the total number of messages sent – Displays percentages in relation to the total number of messages sent. For example, if 300 messages were sent, and if 150 events have been counted, then the bar length will be 50% (because 150 is 50% of 300).
° Percentage of the total number of unbounced messages sent – Displays percentages in relation to the total number of messages sent that have not been bounced. For example, if 300 messages were sent, and 50 bounced, there would be 250 unbounced messages. And if 150 events have been counted, then the bar length will be 60% (because 150 is 60% of 250).
· Unique or Total Events – Selects the type of events to include in the report.
° Count only events unique for each recipient – Plots only a single event of each type for each recipient. Recommended when one of the percentage result calculations has been selected. This chart will register “0” (zero) events if blind tracking has been selected for the tracking type during the tracking definition because blind tracking cannot count any event as unique.
° Count all events – Plots all events triggered for each recipient and is available for blind tracking.
Figure 91 Result Settings Tab for the Sum of Events Option
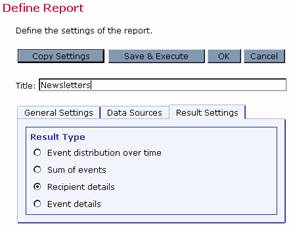
The Recipient details option is only used for personal or anonymously tracked jobs because this report type is linked to recipient profile data. This report type displays a multi-frame table that lists each data source and the profile field columns from the recipient definition. You must then download the report to get the recipient detail data.
Figure 92 Result Settings Tab for the Recipient Details Option
The Event details option is available for personal, anonymous, unique, and blind tracking jobs. The report type displays a table that lists the report type, time period of the report, allows for the selection of encoding for downloading the data, and allows for the selection of the time zone to reference the downloaded data. You must then download the report to get the event detail data.
Figure 93 Result Setting Tab for the Event Details Option

There are several ways to execute reports. LISTSERV Maestro can produce quick reports that are instantly viewable on the screen from the Test Report tab on the Job Details screen (see Section 7.3 Running Test Reports for more information) and from the Reports tab on the Delivered Jobs Details screen (see Section 9.3 Delivered Job Reports for more information). LISTSERV Maestro can also produce reports from the Tracking Reports screen as described in Section 10 Tracking Statistics and Reports.
Each of the four basic types of reports, Event distribution over time, Sum of events, Recipient details, and Event details, has its own unique appearance. Each report type also has its own set of options for viewing, downloading, manipulating, and editing. These options are represented by four icons located at the bottom right side of each report. Clicking on an icons lets you access the options for each report type. The icon currently in use will have a highlighted border around it. Icons that are not available for a particular report type will appear grayed out and will not be clickable.
|
|
View Report – Displays the currently selected report with the latest report options. |
|
|
Download Report – Opens the Download Report Result screen. From here, it is possible to download report data in a zipped text file. |
|
|
Change Results Settings – Opens the Change View Settings for Report screen. From here, it is possible to change how the results are displayed on the report. |
|
|
Create Report / Edit Report – This icon is called Create Report only if the report is a quick report. In that case, the Define Report screens with a new report that is pre-filled with the settings from the quick report. From here, it is possible to save the quick report as a normal report by clicking the [OK] button, or by clicking the [Save & Execute] button, which will display the report again as well as save it as a normal report. For delivery tests, it is not possible to save a quick report as a regular report, so this icon is disabled (grayed out). If an existing report from the reports list is executed by clicking its title or by clicking the [Save & Execute] button, this icon is called Edit Report. The Define Report screen opens, but a new report is not created. Instead, the existing report is opened the same way it is opened from the report list when the Edit link next to the report title is clicked. |
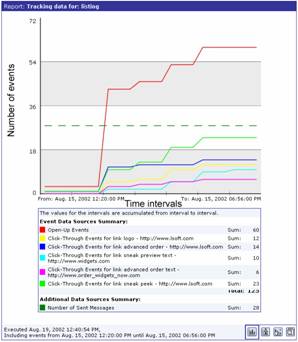
An Event Distribution report plots the occurrence of events (open-up and/or click-through) over time. A simple line graph shows the number of responses over time. Time is plotted on the x-axis of the chart and can be measured in intervals of hours, days, or weeks. Events are charted on the y-axis and can be measured as the number of events or as a percentage of either the total number of messages sent, or the total number of unbounced messages.
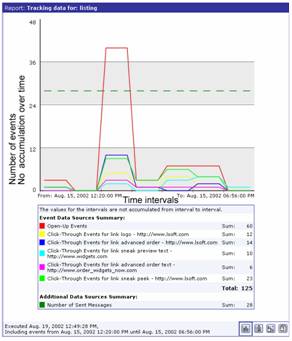
The View Report screen of an Event Distribution report displays the collected data in a chart format. The View Report screen of this report type changes to reflect different options set on the Change View Settings for Report screen. Depending on what options are set, events on the y-axis can reflect the total number of events, or a percentage of either the total number of messages sent, or the total number of unbounced messages sent. Events occurring over time can be reflected as a total accumulation; each set of measured events is added to the previous set so the plotted data continuously accumulates until all events stop and a plateau is reached. Alternatively, events occurring over time can be reflected as accrued numbers, plotting the data as a series of peaks and valleys.
Figure 94 Events Distributed Over Time Report Variations
|
Event distribution over time chart
|
Event distribution over time chart
|
Figure 95 Events Distributed Over Time Report Variations
|
Events distribution over time chart with the
|
Events distribution over time chart with the
|
It is possible to download the data from an event distribution report by clicking the Download Report icon. Data downloaded will be in the form of a zipped text file. Select the time zone that will be used to format the data from the drop-down menu. Click the [Download] button to begin downloading the data.
Figure 96 Downloading Event Distribution Report Data
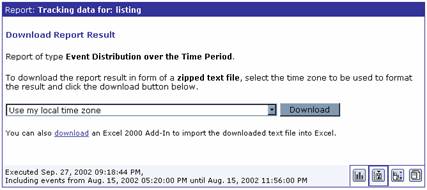
Tip: Click the download link to download an Excel Add-In to import the data into Excel. See Section 10.7 Using the Excel Add-In for more information.
The Change View Setting for Report screen allows the user to change specific options and, as a result, change the appearance of the report on the View Report screen and change the data that is downloaded on the Download Report Result screen. Any changes made on the Change Result Settings screen do not change the actual report definition; they are only temporary, allowing the user to see different views and download different data. To change the report permanently, changes need to be entered on the Result Settings tab on the Define Reports screen, and then the changed report must be saved. See Editing a Report for more information.
For an Events Distribution report the following options can be selected:
· Result Calculation – Defines how the results on the chart are calculated.
° Total number of events – Displays the total number of events counted per time interval. For example, if 123 events were counted for an interval, the resulting line height for that interval would be 123.
° Percentage of total number of events – Displays percentages in relation to the total number of messages sent. For example, if 300 messages were sent, and if, in one interval, 150 events were counted, the line height for that interval would be 50% because 150 is 50% of 300.
° Percentage of total number of unbounced messages sent – Displays percentages in relation to the total number of messages sent that have not bounced (at the time the report is executed). For example, if 300 messages were sent and 50 messages bounced, there would be 250 unbounced messages. And, if in one interval, 150 events were counted, the line height for that interval would be 60% because 150 is 60% of 300.
· Interval Size – Events are counted as occurring within a certain amount of time. This amount of time is referred to as an interval. Intervals can be set as hours, days, or weeks.
· Result Accumulation – Defines whether the values accumulate from one interval to the next.
° No accumulation – Each interval’s events are counted and plotted for only that time period. The resulting line on the chart displays as a series of peaks and valleys.
° Accumulate interval values – Each interval’s events are counted and plotted, adding to the previous interval’s events until the end of the report period. The resulting line on the chart displays as ever increasing. The incline will become less steep over time until it plateaus into more or less a straight line once recipients no longer trigger events.
Figure 97 Change View Settings
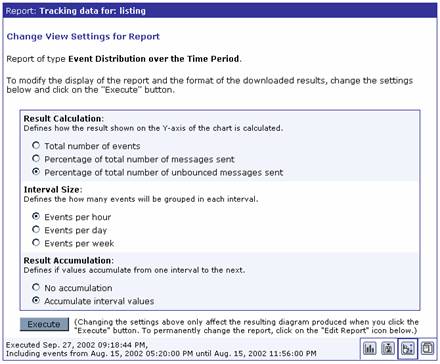
Click the [Execute] button to change the View Report screen (the appearance of the chart or graph), and change the downloadable data.
To change the definition of the current report, click the Edit Report icon. The Define Report screen opens if the user has the right to edit reports. The current report’s General Settings, Data Sources, and Result Settings can be edited and saved to reflect any changes in the current report, or they can be saved as a new report. See Section 10.1 Tracking Reports for more details.
If the current report is a quick report from Delivered Jobs, clicking the Create Report icon will allow the user to create a new report based on the settings of that quick report. Type in a title for the report and then click [OK] to save the quick report as a regular report. Alternatively, click [Save & Execute] to execute the report again (display it) and save the quick report as a regular report. The report title will then show up in the listing of current reports on the Tracking Reports screen. Edit the settings of this new report by clicking the Edit Report icon again. This option is not available for quick reports generated from delivery test data. See Section 9.3 Delivered Jobs Reports for more information.
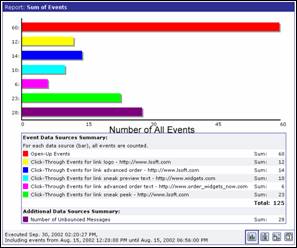
The Sum of events option produces a bar graph that shows the number of recipients who clicked on each URL and/or opened up the email message. For each data source, all events of the selected type (click-through and/or open-up) and for the selected links (in the case of click-through), are summed up and displayed in the form of a colored bar.
Two types of sum can be chosen for the report – Sum of unique events or Sum of all events. Sum of unique events plots only a single event of each type for each recipient. This chart will register “0” (zero) events if blind tracking has been selected for the tracking type during the tracking definition because blind tracking cannot count any event as unique. Sum of all events counts all events triggered for each recipient and is available for blind tracking.
The Sum of all events will give an overall picture of how many events were generated. When compared to the Sum of unique events, the report gives an idea of how well the overall number of events was distributed over the individual recipients. It is possible to discern whether many recipients generated relatively few events each, or whether most events were generated by only a few recipients (generating the same events over and over), while many other recipients only generated a few events (or none at all).
The View Report screen of a Sum of Events report displays the collected data in a bar graph format. The View Report screen of this report type changes to reflect different options set on the Change View Settings for Report screen. Depending on what options are set, the number of recipients can reflect the total number of all recipients, or a percentage of the number of recipients who triggered an event.
Figure 98 Sum of Events Report Variations
|
Sum of Unique Events
|
Sum of All Events
|
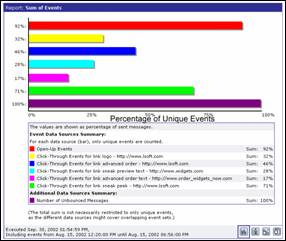
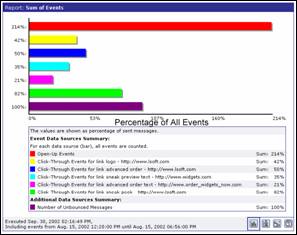
Figure 99 Sum of Events Report Variations
|
Sum of Unique Events as Percentages
|
Sum of All Events as Percentages
|
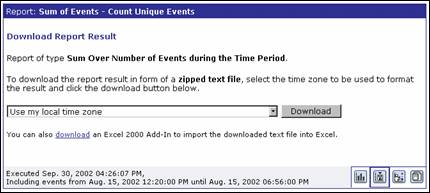
It is possible to download the data from a sum of events report by clicking the Download Report icon. Data downloaded will be in the form of a zipped text file. Select the time zone that will be used to format the data from the drop-down menu. Click the [Download] button to begin downloading the data.
Tip: Click the download link to download an Excel Add-In to import the data into Excel. See Section 10.7 Using the Excel Add-In for more information.
Figure 100 Download Sum of Events Data
The Change View Settings for Report screen allows the user to change specific options and as a result change the appearance of the report on the View Report screen and change the data that is downloaded on the Download Report Result screen. Any changes made on the Change View Settings for Report screen do not change the actual report definition; they are only temporary, allowing the user to see different views and download different data. To change the report permanently, changes need to be entered on the Result Settings tab on the Define Report screen and then the changed report saved. See Editing a Report for more information.
For a Sum of Events report, the following options can be selected:
· Result Calculation – Defines how the results on chart are calculated.
° Total number of events – Displays the total number of events. For example, if 123 events have been counted, the resulting bar length for will be 123.
° Percentage of total number of events – Displays percentages in relation to the total number of messages sent. For example, if 300 messages were sent, and if, for a data source, 150 events have been counted, then the line length for that data source will be 50% (because 150 is 50% of 300).
° Percentage of total number of unbounced messages sent – Displays percentages in relation to the total number of messages sent that have not been bounced (yet). For example, if 300 messages were sent, and 50 bounced, there would be 250 unbounced messages. And, if 150 events have been counted, then the bar length for that data source will be 60% (because 150 is 60% of 250).
· Unique or Total Events – Select whether to count all events that are tracked, or only unique events triggered by recipients.
° Count only events unique for each recipient – For each recipient, only one event of each type is counted. For example, if open-up and click-through events are being tracked and a recipient opened the message twice and clicked on the same link three times, only two events would be counted. This method of counting is recommended when one of the percentage result calculations is selected.
° Count all events – For each recipient, all triggered events are counted. Using the example above, five events would be counted using the Count all events option.
Figure 101 Change View Settings for Sum of Events Report
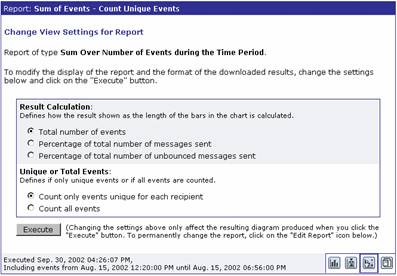
Click the [Execute] button to change the View Report screen (the chart or graph), and change the downloadable data.
To change the definition of the current report, click the Edit Report icon. The Define Report screen opens if the user has the right to edit reports. The current report’s General Settings, Data Sources, and Result Settings can be edited and saved to reflect any changes in the current report, or they can be saved as a new report. See Section 10.1 Tracking Reports for more details.
If the current report is a quick report from Delivered Jobs, clicking the Create Report icon will allow the user to create a new report based on the settings of that quick report. Type in a title for the report and then click [OK] to save the quick report as a regular report. Alternatively, click [Save & Execute] to execute the report again (display it) and save the quick report as a regular report. The report title will then show up in the listing of current reports on the Tracking Reports screen. Edit the settings of this new report by clicking the Edit Report icon again. This option is not available for quick reports generated from delivery test data. See Section 9.3 Delivered Jobs Reports for more information.
The Recipient Details option is only used for personal or anonymously tracked jobs because this report type is linked to recipient profile data. This report type displays a multi-frame table that lists each data source and the profile field columns recipient definition. Use the table to select which data sources and which columns will be downloaded. Data can be downloaded and then imported into a statistical software program to generate charts and graphs.
Note: The downloaded file is in form of a ZIP archive file. The report data in this file appears as comma separated data (CSV).
The upper frame displays a Select link for each job-group in each data source. Click on the link to make a certain “job-group” the currently selected one.
Note: A job-group puts together all jobs in a data source where the recipients have the same profile structure (i.e. the same number of profile columns with the same column labels). Column order is ignored. This means that if you have several jobs in a data source, and all of the jobs have recipients with the same profile structure, then all of these jobs will be grouped together into one job-group. If, in the same data source, there are jobs where recipients have a different profile structure, then these jobs will have their own group(s) inside of the data source.
In the lower frame, the currently selected job-group is displayed with the color and name of the data source the job-group belongs to, as well as a list of all jobs in the group.
The Available Columns section displays all columns that make up the structure of the profile of the recipients in the selected job-group. In addition, a special purpose column, called {COUNT}, is included.
The Selected Columns section displays the columns that have been selected for download. You can manipulate this list by clicking on the Select All link, which will turn all available columns into selected columns. You can also click the Edit link to select only those columns you want to download, as well as the order in which they appear in the file.
From the File Encoding drop-down menu, select the encoding to be used for the text file inside of the ZIP archive file. Next, click the [Download] button to start the download.
Figure 102 Recipients Details Report
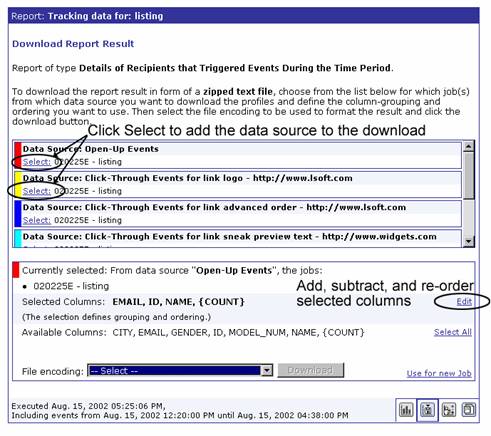
Tip: If personal tracking was used and the EMAIL column is selected for the report, then the report can be used as the recipient data source for a new job. Click the Use for new job link to create a new job with a recipients list where each recipient that triggered one of the events counted by the selected data source would have an entry. This would be the same as if you selected all columns in alphabetical order, except for the {COUNT} column, downloaded that report, and then uploaded it as the recipients list of a newly created job. The link will take you to the Start New Job screen where you will need to type in a title for the new job. After that, a new job with recipients already defined will be created.
When downloaded, the text file in the ZIP archive file will contain a table with the columns that you have selected – in the order you selected them. The rows in this table are generated in the following way:
For each recipient that generated at least one of the events that are counted by the selected data source, one entry is made. Each entry consists of the profile values of this recipient, which are placed into their matching columns. However, only those profile values that match any of the columns you have selected will be used. All columns not selected will be ignored. Because of this, several recipients may now have the same "condensed" profile. This would happen if the only differences in the profile of the recipients were in columns that are not used because they were not selected.
For example, if you use the EMAIL, GENDER, and CITY columns, then each recipient will most likely have a different profile. This is because the combination of EMAIL, GENDER, and CITY will probably be unique for each recipient. However, if you only select the GENDER and CITY columns to form a "condensed" profile, then, in all likelihood, you will have several recipients with the same profile, namely all those of the same gender that live in the same city.
If, during the creation of the report, several recipients are found to have the same "condensed" profile, this profile will be included in the report table only once. Instead of including the same profile several times, LISTSERV Maestro simply counts how many recipients share the same profile for each unique profile.
In the special purpose column, called {COUNT}, each instance of an event for the same profile is recorded. If you include this column, then it will be populated with the number of recipients that were matched to the "condensed" profile defined by the other columns in the same row. Using the {COUNT} column allows you to find out interesting demographic statistics such as how many males or females from a certain city have clicked on a certain link.
Note: The rows in the table will be sorted in ascending order on the first column. If there are profiles with the same values in the first column, then they will be sorted after their second column, and so on.
Example
Assume that the full profile has the three columns from above -- EMAIL, GENDER, and CITY. Also assume that if you included all columns plus the {COUNT} column, then your report table would look like this:
CITY,GENDER,EMAIL,{COUNT}
New York,female,sally@somewhere.com,1
New York,male,john@somewhere.com,1
New York,male,robert@somewhere.com,1
Washington,female,debby@somewhere.com,1
Washington,male,frank@somewhere.com,1
This table means that each of these recipients has generated
one event of the type being counted by the data source. You can also see
the sort order after first, second, and third column.
Now, if you would leave out the EMAIL column, the result would be:
CITY,GENDER,{COUNT}
New York,female,1
New York,male,2
Washington,female,1
Washington,male,1
As you can see, John and Robert from New York, which differed only in their email addresses, are now aggregated into the "male from New York" profile, and there are now two events shown as coming from recipients that match this profile, one from John and one from Robert.
If you would also leave out the GENDER column, the result would be:
CITY,{COUNT}
New York,3
Washington,2
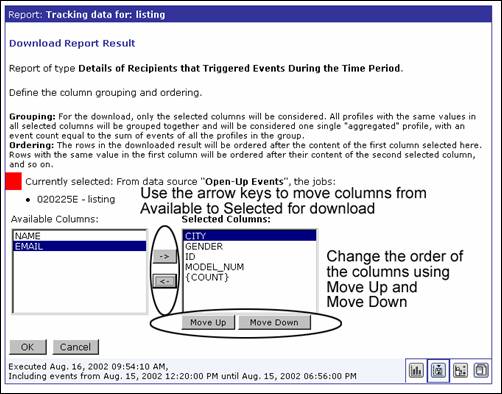
The Download Report Result screen lets you select the columns you want to include in the download of the Recipient Details report, and the order in which they occur.
The left box shows all available columns that are currently not selected. It will be empty if all are selected. The right box shows the currently selected column(s). It will be empty if none are selected.
To select a column:
· Click on the desired column in the left box to highlight it.
· Click the arrow button to move it into the right box.
To place the new column in a certain position, select the item in the right box that appears after the position where you want the new item to appear. You can always change the ordering at a later time, see below.
To unselect a column:
· Click on the desired column in the right box to highlight it.
· Click the arrow button to move it back to the left box.
To change the order of the items in the selected list, click on the item you want to move, and then use the [Move Up] and [Move Down] buttons to move the item.
Figure 103 Recipient Details Report Column Selection
Click [OK] when you are done or [Cancel] to discard your changes.
If you clicked [OK], then the Download Report Result screen will reopen. Choose the file encoding for the download from the drop-down menu. Click the [Download] button to begin downloading the data.
To change the definition of the current report, click the Edit Report icon. The Define Report screen opens if the user has the right to edit reports. The current report’s General Settings, Data Sources, and Result Settings can be edited and saved to reflect any changes in the current report, or they can be saved as a new report. See Section 10.1 Tracking Reports for more details.
If the current report is a quick report from Delivered Jobs, clicking the Create Report icon will allow the user to create a new report based on the settings of that quick report. Type in a title for the report and then click [Save & Execute] to save the quick report as a regular report. The report title will then show up in the listing of current reports on the Tracking Reports screen. This option is not available for quick reports generated from delivery test data. See Section 9.3 Delivered Jobs Reports for more information.
The Event details report is available for personal, anonymous, unique, and blind tracking jobs. This report type displays a multi-frame table that lists each data source. Use the top frame to select the data source, and the bottom frame to select the time zone and file encoding to be used to format the downloaded data. Data must be downloaded and can be imported into a statistical software program to generate charts and graphs.
Figure 104 Event Details Report
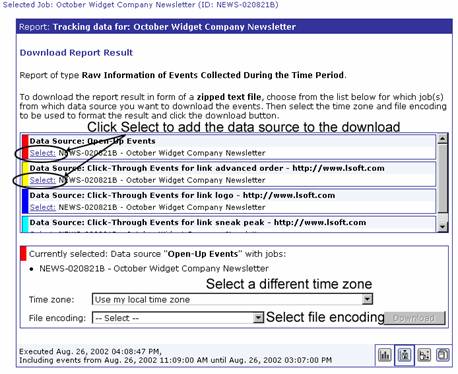
Select the data source from the top frame by clicking the Select link. The currently selected data source will appear in the lower frame. Select the time zone from the top drop-down menu and the file encoding from the bottom drop-down menu. Click the [Download] button to download the raw data to a local drive.
The downloaded data CSV file contains comma separated and quoted <”> tabular data with the following columns:
· EVENT_TIME – The date and time, to the second, when the event was triggered.
· RECIPIENT_ID – ID of the recipient who triggered the event. If the tracking type is Personal, then the RECIPIENT_ID will be the actual ID of the recipient as defined by the account holder in the Tracking wizard.
If the tracking type is Anonymous, this field will contain a 1-based integer number, which is an internal identifier of the anonymous profile that matches the recipient who triggered the event. This number cannot be used to identify an individual recipient who triggered an event, but can be used to determine if two events were triggered by a recipient with the same anonymous profile (the same number will be used). This number is also used internally in the Recipients Details report to download the profiles that triggered certain events.
If the tracking type is Unique, this field will contain a 0-based integer number that was given out to the recipient during sending. This number cannot be used to identify which recipient triggered which event, but it can be used to determine if multiple events were triggered by the same recipient (the same number will be used).
If the tracking type is Blind, the field will always contain the default value “DEF” and cannot be used to find anything out about the recipient.
· CLIENT_ADDRESS – The IP address of the recipient who triggered the event. This is only present for personal tracking, and will appear as “0.0.0.0” for all other types of tracking.
· EVENT_TYPE – Either click (for click-through) or openup (for open-up) will appear depending on the type of event.
· BODY_TYPE – For open-up events, this field will always be empty because only HTML messages can track open-up events. For click-through events, the body part of the message containing the event will be listed. Possible body types are:
° Plain – URL in the body of a plain text message.
° Alt – URL in the text alternative of the HTML message.
° HTML – URL in the HTML body of the message.
° XAOL – URL in the AOL format alternative of the HTML message.
· URL – For open-up events, this will always be empty. For click-through events, the URL that was clicked is listed.
· ALIAS – For open-up events, this will always be empty. For click-through events, the alias of the URL that was clicked is listed. If there is no defined alias, this field will be empty.
· FULL_JOB_ID – The full Job ID including the User Prefix of the job that triggered the event.
· AGENT – The user agent string transmitted by the client software of the recipient who triggered the event. This identifies the browser software that was used to click on the link.
To change the definition of the current report, click the Edit Report icon. The Define Report screen opens if the user has the right to edit reports. The current report’s General Settings, Data Sources, and Result Settings can be edited and saved to reflect any changes in the current report, or they can be saved as a new report. See Section 10.1 Tracking Reports for more details.
If the current report is a quick report from Delivered Jobs, clicking the Create Report icon will allow the user to create a new report based on the settings of that quick report. Type in a title for the report and then click [Save & Execute] to save the quick report as a regular report. The report title will then show up in the listing of current reports on the Tracking Reports screen. This option is not available for quick reports generated from delivery test data. See Section 9.2 Delivered Jobs Reports for more information.
The statistics downloaded from LISTSERV Maestro are in CSV format. The data from the Event Distribution and Sum of Events reports can easily be imported into Microsoft® Excel in order to create tables, graphs, and other forms of reports. LISTSERV Maestro comes with an easy to use Excel Add-In that makes this import process a matter of a few clicks.
The add-in must be installed into Excel before it can be used. This step is done only once on each workstation, before the add-in is used for the first time. If there is an existing version of the add-in file from an earlier build of LISTSERV Maestro, it must be removed from the local machine and the newest version installed. Please see the Section 10.7.4 Removing an Existing Version of the Add-In for instructions on how to proceed.
From any Event Distribution report or Sum of Events report, click the Download Report icon. This will open the Download Report Result screen. Next, click the download link located under the time zone drop-down menu. The Microsoft Excel Add-In for Tracking Statistics Import screen opens. Click on the ImportTrackerStatistics.xla link to download the add-in file.
Figure 105 Microsoft Excel Add–In for Tracking Statistics Import Screen
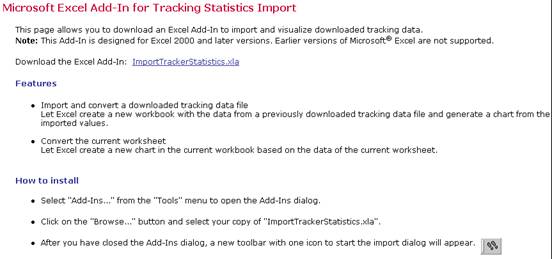
Follow the steps described below to install the add-in into Microsoft Excel 2000 or later:
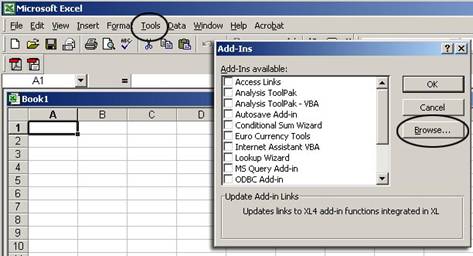
1. Open Microsoft Excel.
2. From the Tools menu, select Add-Ins (It may be necessary to click on the small arrow symbol at the bottom of the menu to make the command visible.) The Add-Ins screen opens, listing all available add-ins. Click the [Browse…] button.
Figure 106 Installing Tracker Add-In
3. A file selection screen opens. Navigate to the folder where the downloaded file was saved, and then click [OK].
4. The Add-Ins screen reopens. There will now be an entry for the LISTSERV Maestro add-in, Importtrackerstatistics, which should already have a check mark in front of it (if not, check the box). Click [OK] to install the add-in.
Figure 107 Browse for Add-In File
A new toolbar icon that looks like two footprints will appear in the Excel toolbar. This icon will start the LISTSERV Maestro data import.
Figure 108 New Excel Tool Bar Button
Download the data to be imported into Excel. The data is downloaded in a compressed ZIP file. Open the ZIP file. There are at least two files contained inside, a readme.txt file, another file named for the type of data downloaded, and, optionally, the additionalStatistics.txt file. Extract the *.txt files and save them on a local drive.
The readme.txt file will contain a summary of the report type and other information. The additionalStatistics.txt file contains any additional statistics (i.e. the number of emails sent or the number of bounces) that were requested in the report. The main data file, named for the type of data downloaded (i.e. distributionReport.txt or uniqueSumReport.txt) contains the data that will be imported into Excel. Start Excel and click on the Visualize Tracking Statistics icon in the toolbar, it looks like two small footprints.
The Visualizing Tracker Statistics screen opens. Select the Import and convert a downloaded tracking data file option to create a new workbook and generate a chart based on the downloaded tracking data.
Figure 109 Using Tracker Add-In with Excel Import Dialog Box
Click the [Start] button. A file selection screen will open. Navigate to the *.txt file with the tracking data previously downloaded and open this file. Excel will automatically open a new workbook. Once the workbook has been created successfully, save it using the Save Statistic File screen. After the file had been saved, a message will appear saying the data has been successfully imported and saved as an Excel Workbook. Click [OK] to close the message.
The new workbook has two sheets. The first sheet shows the imported tracking data in chart form.
Figure 110 Example Excel Graph Event Distribution Over Time
The second sheet contains a value table with the downloaded tracking data.
Figure 111 Example Excel Data Table
It is now possible to use all the regular Excel features to edit and adjust both the graph and the data table.
Select the Convert the current worksheet option on the main add-in menu to create a new chart in the current workbook based on the data of the current worksheet.
If there is an existing ImportTrackerStatistics.xla file from an earlier version of LISTSERV Maestro installed on the local machine, it may not work with downloaded report data from the newest version of LISTSERV Maestro. The old add-in file must be removed from Excel and a new one must be installed. Follow the steps below to remove an old ImportTrackerStatistics.xla file from Excel and install the latest version.
1. Open Excel. If there is an existing version of the add-in, then an icon with little feet will appear in a toolbar.
2. Click Tools > Add-Ins… > Uncheck the Importtrackerstatisticsa add-in from the list, and then click [OK].
3. Click View > Toolbars > Uncheck Tracker-Statistics (the little feet icon should disappear).
4. Click View > Customize… > Toolbars tab > select the Tracker-Statistics listing from the menu (do not check the box) > Click [Delete].
5. Close Excel.
6. Log in to LISTSERV Maestro.
7. Create a quick report, Event Distribution report, or Sum of Events report.
8. Click the Download Report icon.
9. Click the download link to download the Excel Add-In.
10. Right-click the ImportTrackerStatistics.xla link.
11. Select Save Target As from the menu.
12. Save the file on a local drive. (If there is an existing version of this file in the same location the new file is being saved in, a query will ask to replace the existing file. Click [Yes].)
13. Open Excel.
14. Click Tools > Add-Ins… > click [Browse…]
15. Browse for the ImportTrackerStatistics.xla file that was downloaded, and select it.
16. If there is an existing version, a query will ask to replace the existing file. Click [Yes]. (The little feet icon should re-appear on the toolbar.)
17. Click the little feet icon, click [Start], and follow the directions from there.
Important: If the new version of the ImportTrackerStatistics.xla file is downloaded and saved in a different location than the old version, the existing file will not be replaced after answering [Yes] to the query. The old file may remain associated with Excel even when the new version is selected under Tools > Add-Ins… > Browse…If this is the case, an error message will appear saying the file already exists and it is not possible to have two versions of the same file. To correct this situation, search for all versions of the ImportTrackerStatistics.xla file on your local drive and delete them. Then follow all the steps above.