Email How-To Tip |
By Jani Kumpula
Senior Webmaster/UI Designer, L-Soft
In Part 1 and Part 2 of this tip, you learned how to get started with LISTSERV Maestro by sending your first email campaign. We also explored the reporting capabilities of LISTSERV Maestro and how to turn your engagement data into smart and automated campaigns based on subscriber behavior. In this final installment, let's dig deeper and see how we can create more advanced reports and understand trends over time.
")
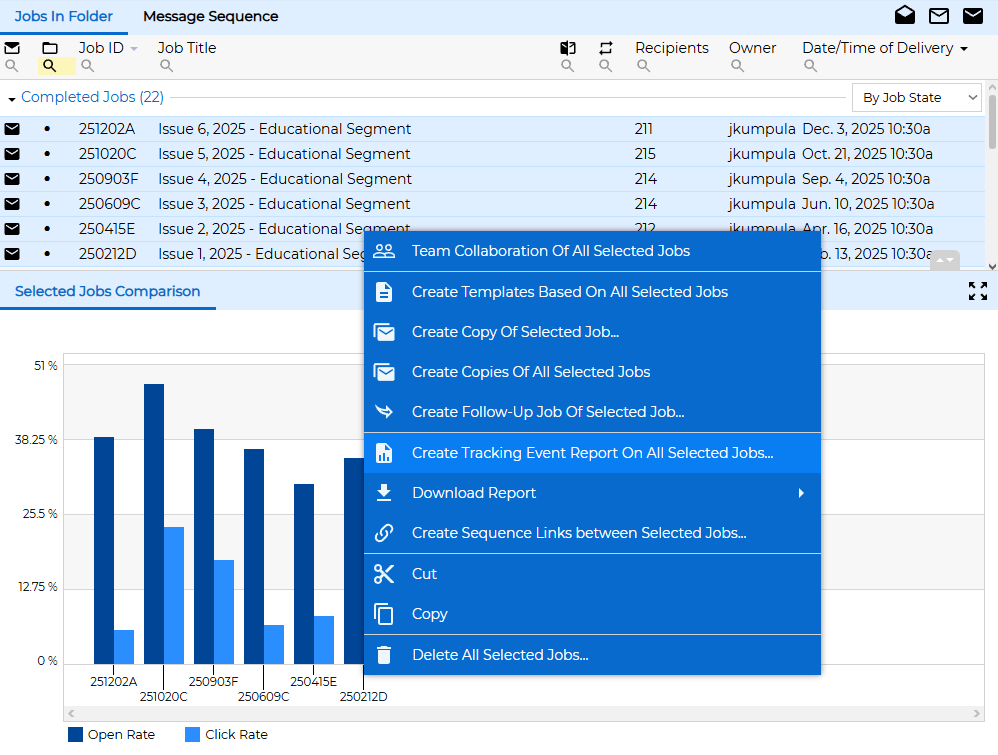
After you have started sending out frequent email campaigns, you will likely want to start creating custom reports and examining trends in your metrics. Whenever you want to create custom reports or if you want to compare the performance of multiple campaigns, go to "Mail Jobs" and highlight the jobs that you'd like to include in your report. Then right-click and choose the "Create Tracking Report on All Selected Jobs" option.
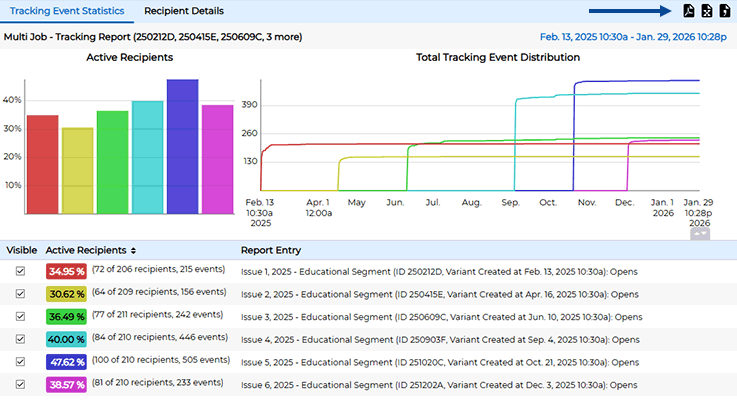
The screen that follows contains a number of options for what to include in the report depending on the data that you're interested in. You can include opens, clicks, social media shares, email forwards and unsubscribes. You can compare email campaigns with one another or aggregate all opens and clicks into one single report. You can also report mobile and desktop actions separately or combined.
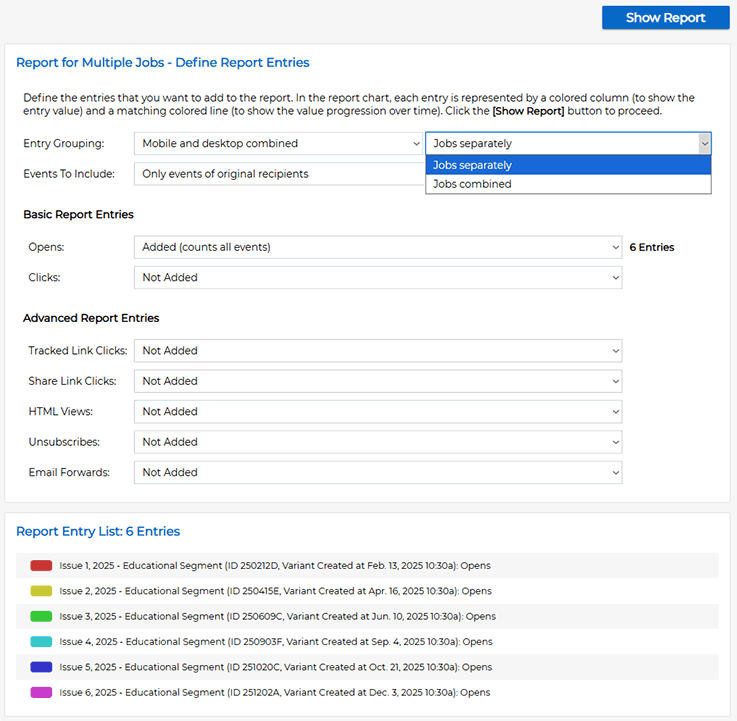
All of the reports can be downloaded as PDF files or spreadsheet documents, allowing you to analyze the data further and to easily share it with your colleagues.
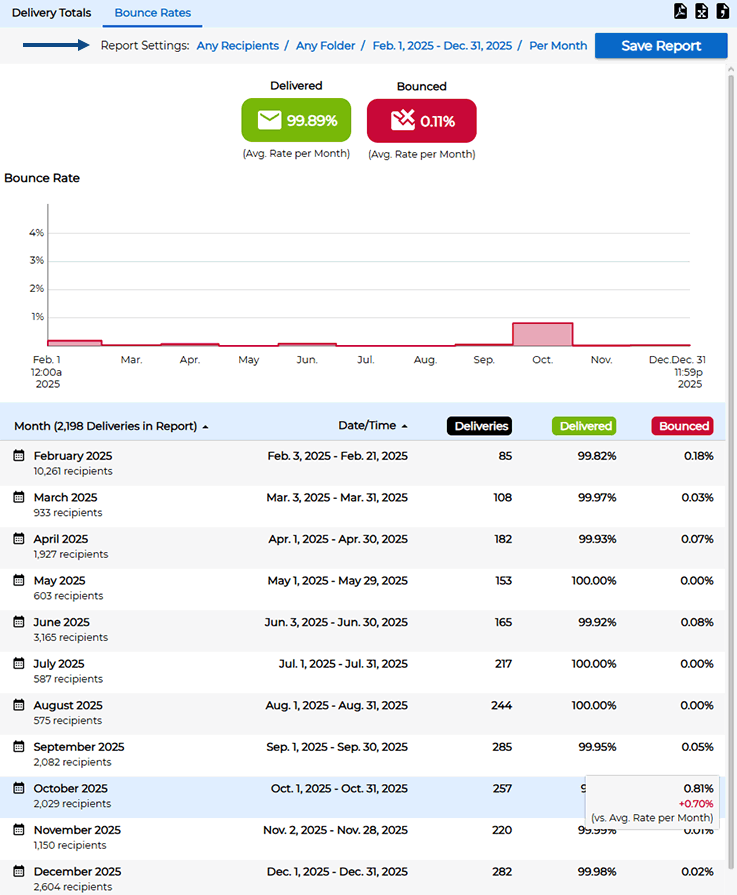
To examine trends and get performance metrics on all of your email campaigns over time, use the main menu and click on "Reports". On the left side of the screen, you will notice two automatically generated reports called "Tracking Statistics" and "Delivery Statistics". The delivery report shows the average delivery and bounce rates for all of your mail jobs over time. The "Delivery Totals" tab shows the total number of delivered and bounced messages, while the "Bounce Rates" tab shows percentages.
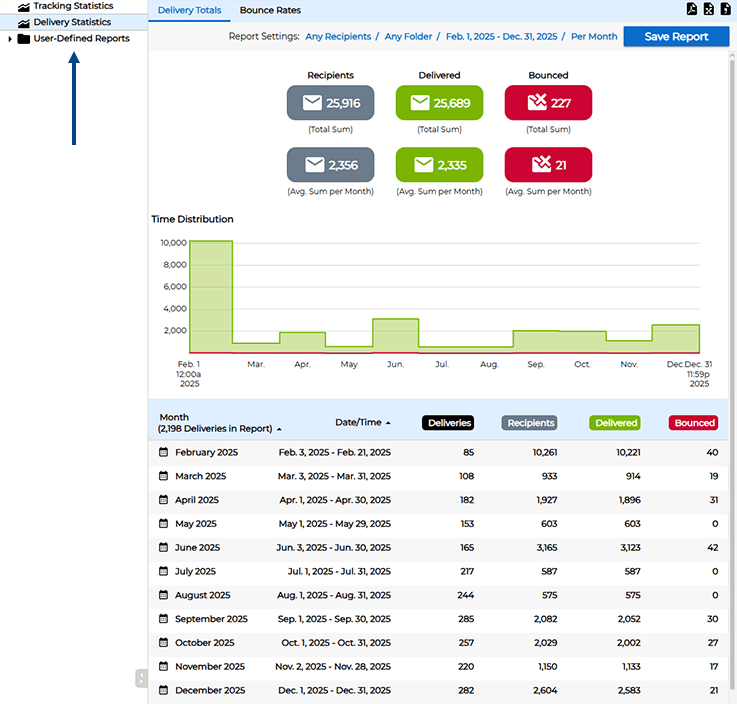
You can customize the time period, interval and mail jobs to include in the report by clicking on the report settings at the top of the screen. If you move your mouse over the table, you will see whether the rate was better than average or worse than average for each time period.
To access the open and click rates for all of your email campaigns over time, click on "Tracking Statistics". You will now see the same type of report, this time showing the open, click and unsubscribe rates over time. Again, if you move your mouse over the table, you'll see if the open and click rate was better or worse than average for each time period.
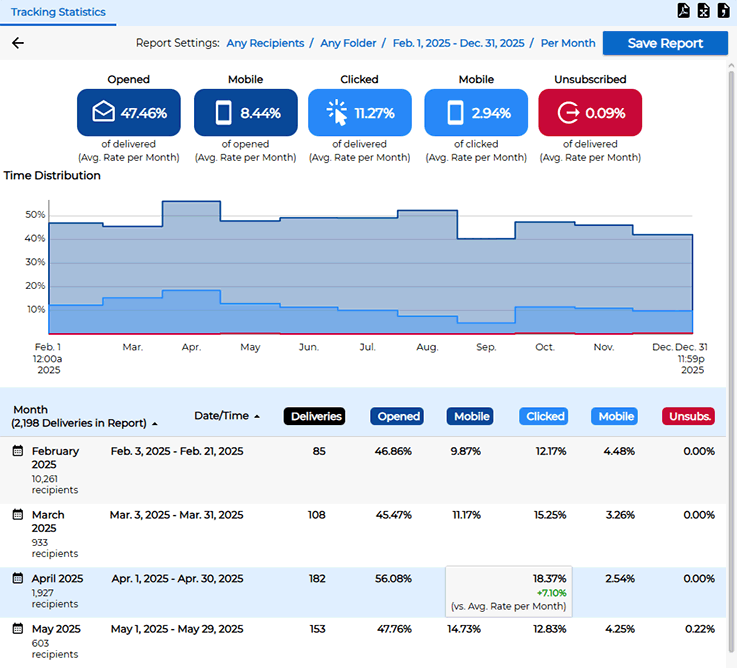
You can sort the table by date, open rate, click rate or unsubscribe rate, making it easy to locate the best and worst performing campaigns. You can also click on the name of each mail job to take a closer look at the performance metrics for that job.
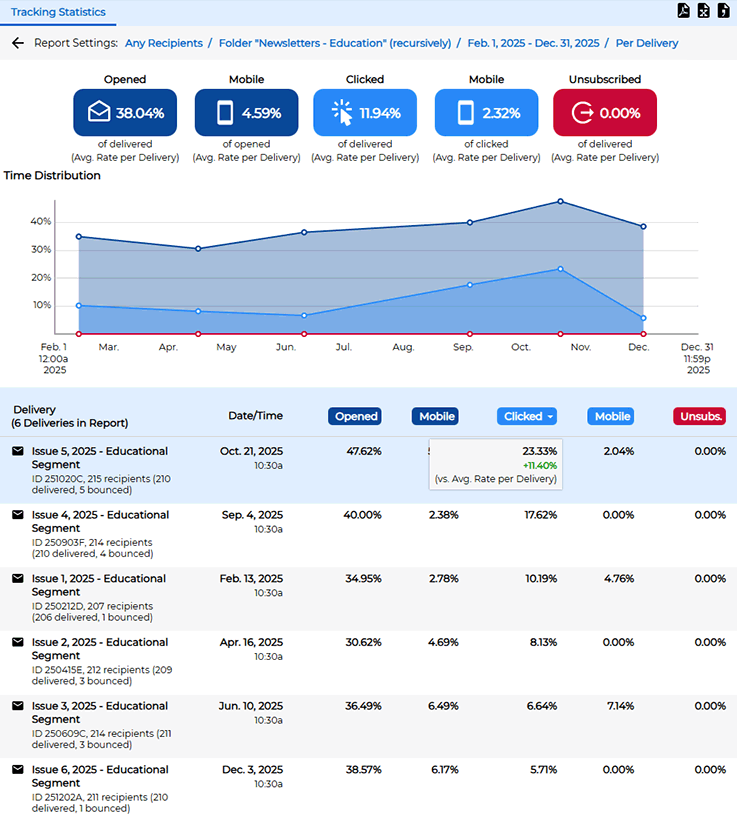
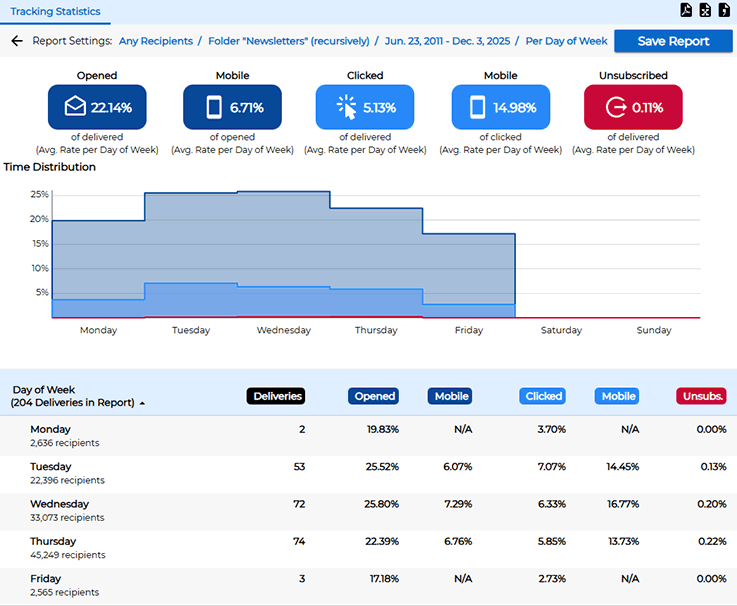
The flexible filtering options allow you to dig deeper and pinpoint the optimal delivery days and times to engage your subscribers. To do this, click on the "Per Delivery" filter at the top of the screen. You'll notice that there are many additional options. Instead of looking at each individual mail job, you can choose to break down your engagement metrics per month, week, day of the week or hour of the day.
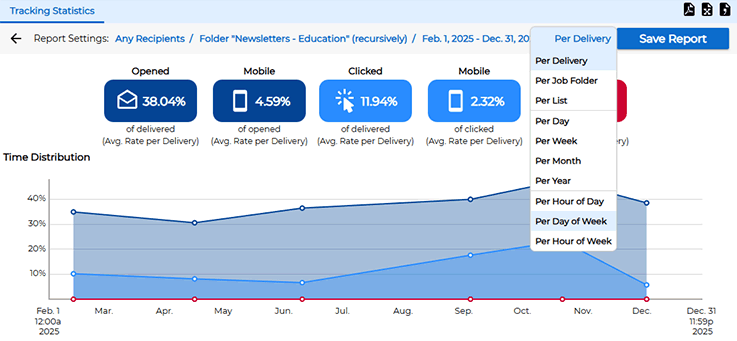
For example, if you select the "Per Day of Week" option, you can easily see what weekdays have the highest and lowest engagement metrics, which can inform you when to send future email campaigns for best results.
The "Per Hour of Day" option shows the same kind of performance metrics, this time divided by hour of day when your email campaigns were sent. This makes it easy to identify whether your email campaigns had better engagement metrics when you sent them in the mornings, for example, or in the afternoon. By taking advantage of this information, you'll learn more about your unique target audience so that you can send future campaigns on days and times when your subscribers are more likely to act on your messages.
We hope this three‑part quick start guide will help you get up and running with LISTSERV Maestro and inspire you to take full advantage of its capabilities.
Part 1: Setup and First Campaign
Part 2: Analytics and Automation
Part 3: Advanced Reports and Trends
Was this article helpful to you? Would you recommend it to a colleague? Your input helps us create content that truly supports your work. Thank you!
|
Want More Insights? Catch up with the latest LISTSERV developments, industry best practices, expert tips, tutorials and more. |
LISTSERV is a registered trademark licensed to L-Soft international, Inc.
See Guidelines for Proper Usage of the LISTSERV Trademark for more details.
All other trademarks, both marked and unmarked, are the property of their respective owners.